Effect of supplemental irrigation on yield and water productivity of durum wheat cultivated under drip irrigation in Tadla, Morocco
Abstract
The study of crop response to water deficit is important in areas where water resources are limited such as in Morocco. For this purpose, this study aims to assess yield and water productivity of winter wheat in response to water stress under drip irrigation systems. A field experiment was carried out at INRA Tadla experimental station during two seasons, 2014-15 and 2015-16. In addition to a rainfed regime, three water regimes represented by 100; 67 and 33 % ETc were applied each 7 days interval if rain is missing. The Karim variety used in this study is the most cultivated durum wheat variety in the region. Results showed that average grain yields varied from 3.12 T/ha under rainfed conditions to 8.90 T/ha under 100% ETc. Water use efficiency varied between 16.2 kg/mm/ha under 67% ETc to 13.4 kg/mm/ha under 33% ETc. The 67% ETc treatment was the most efficient for both growing seasons. The actual evapotranspiration (ETa) was 490 mm under 100% ETc water regime. A significant linear relationship was established between ETa and grain yield. Based on these results, it can be conclude that supplemental irrigation of durum wheat using drip irrigation is feasible and more efficient.
Keywords: Durum wheat, drip irrigation, supplemental irrigation, water use efficiency, Tadla, Morocco
INTRODUCTION
Agriculture in general and cereals in particular occupy an important place in the Moroccan economy. Indeed, about 4.7 million hectares are sown every year to cereals, representing approximately 61% of the agricultural area (MAPM, 2017). On the other hand, cereals are contributing for about 50% of crop production, with an average annual production of 60 million quintals (MAPM, 2019). Furthermore, cereals and derivatives play an essential role in the diet of the population, by providing nearly 70 % of calorie requirements and 75% of protein. At the farm level, 46% of feed units are provided by cereals.
However, for several years, Morocco faced recurrent cereal production deficits. Thus, the volume of imports has steadily increased to reach 30% of the country’s needs in 2015 (MAPM, 2016), which led to an imbalance in the trade balance. This deficit is due to the combined effect of the high rate of population growth and low average yields due to recurrent droughts in the country over the past 3 decades. Similarly, most cereal areas are concentrated in arid and semi-arid (200-400 mm) regions where water is the major factor limiting crop production. Indeed, low rainfall and its strong irregularity during the year and between years characterize these zones. The low and fluctuating production in these areas justify the seeking of techniques for improving and stabilizing yields. The irrigated area cultivated to cereals is around 0.85 million hectares in average (Ferrahi et Bekkaoui, 2020). Yields depend on the cropping season and are around 2 t/ha in rainfed areas and 4 t/ha in irrigated areas.
Several studies on water stress effects on wheat under flood irrigation have been carried out for several years at research stations and have allowed the implementation of reasonable irrigation practices (Chati et al., 1999; Arfani, 2002). However, with the development of collective drip irrigation at the irrigated perimeter of Tadla, wheat is concerned by this new technique. The management of this crop by this new technique raises several questions concerning the water requirement to apply and response of yield to water amount. According to the literature, among all the irrigation methods, the drip irrigation is the most efficient and it can be successfully practiced for irrigating of a wide range of crops especially vegetables, orchard crops and field crops but on the other hand, limited studies have been conducted for cereals like wheat (Sanjay et al., 2014). Drip irrigation potentially saves more than 20% of irrigation water compared to surface irrigation (Karrou et al., 2011). To produce one kg of wheat, drip irrigation requires about one ton of water (Hoff, 2018). At the national level, no detailed study has been conducted and published on the feasibility and yields of wheat under drip irrigation.
This study was carried out as part of INRA–ICARDA collaboration project which aims to evaluate and compare yield and water use efficiency of nine new varieties of durum wheat from ICARDA with one of the main variety previously developed by INRA, Karim. This paper reports the results of the performance of Karim variety in response to different levels of water stress applied through drip irrigation.
The objectives of this study, conducted during the two cropping seasons 2014/15 and 2015/16 under drip irrigation were i) to evaluate yield and yield components of Karim variety in response to different irrigation levels and ii) to determine the water-yield relationship and water use efficiency under these water regimes.
MATERIAL AND METHODS
Site description
The research was carried out during the cropping seasons of 2014/15 and 2015/16 at the experimental station of Tadla (X = 32.3°; Y = 6.31’; Z = 450 m) of the National Institute of Agronomic Research (INRA, Morocco). The soil was classified as loamy-silt. The climate of the site area is semi-arid with a high irregularity of rain events. Average annual precipitation is about 268 mm, average temperature is 18°C with a maximum in August which often exceeds 45°C and a minimum in January of approximately 0°C.
The climatic variables for the wheat growing period during experimental years are given in table 1. The climatic data were collected from a local meteorological station. According to table 1, the first cropping season is characterized by low temperature during the months of January and February with temperatures that can approach 0°C. The end of the season (May) is hot and dry with maximum temperatures averaging around 32°C. The first cropping year showed 26 rainy days for a total amount of 375 mm. However, during the 2nd year, the cropping season was hot and dry with a low amount of rainfall. The rainy days were just 12 days for a total amount of 150 mm. This shows the great climatic contrasts among the years.
Experiment design and management
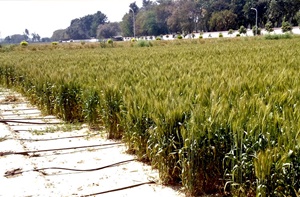
The study was conducted using randomized complete blocks design to illustrate the impact of water deficit on yield and to study some agronomic characteristics of wheat. A split plot layout with three replications is adopted for both cropping seasons of 2014/15 and 2015/16 (Figure 1). In addition to rainfed regime (T0), three levels of irrigation were tested including: 100% (T1), 67% (T2) and 33% (T3) of water requirement (ETc) were considered as the main plots and ten cultivars (Karim, and nine of newly obtained genotypes) as subplots). Karim cultivar was selected for this study as one of the most recommended cultivars for Tadla region. The plots having 3.6 m * 8 m2 were 2 m spaced to minimize the risk of water transfer between compared treatments.
Drip irrigation technique was used by installing lateral lines spaced by 40 cm and tubes equipped with integrated drippers (Flow rate of 2 L/h, spacing of 40 cm). To accurately determine the amount of water applied, we installed nine flow-meters at the entrance of some representative plots of the three water regimes in a diagonal distribution.
Physical and chemical properties before seeding at the soil layers of 0-30, 30-60 and 60-120 cm are reported in Table 2.
The 1st cropping season started by sowing wheat on November 20th of 2014 and harvesting it on June 6th of 2015. During the 2nd year, Wheat was sown on November 19th of 2015 and harvested on May 26th of 2016. For both crop years, the seed rate was 305 seed m-2, with a row spacing of 0.20 m. Before sowing, 70 kg/ha N and 82 kg/ha P2O5 were applied to all plots following recommendations of soil analysis. To ensure optimal crop nitrogen nutrition during the season, 65 kg/ha N was added at early tillering stage. Appropriate pesticides were applied to limit disease and weed infestations.
Observations and measurements
Theoretical water deficit (TWD, mm) for each treatment was calculated by:
TWD = Kc.ajst. ET0. krc (1)
Where Kc.ajst is adjusted crop coefficient determined using method given in FAO paper n°56 (Allen et al., 1998), ET0 is the reference evapotranspiration (mm day-1). The reduction coefficient Krc defines the irrigation treatments. It was set to 1, 2/3 and 1/3 for T1 (100% ETc), T2 (67% ETc) and T3 (33% ETc), respectively. ET0 was calculated using the FAO Penman Monteith formula (Allen et al., 1998):
(2)
Where ETo is the reference evapotranspiration (mm d-1), Rn is the net radiation at the surface of the crop (MJ d1.m-2), G is the soil heat flux (MJ.d- 1), T is the average daily air temperature at 2 m from the ground surface (°C), µ is the wind speed at 2 m from the ground surface (m.s-1), es is the pressure saturation vapor pressure (KPa), ea is the current vapor pressure (KPa), (es – ea) is the saturation pressure deficit (KPa), Δ is the slope of the vapor pressure curve (KPa.°C- 1) and γ is the psychrometric constant (KPa.°C-1).
Under such conditions, water amounts vary between treatments. Water used was of high quality with an electrical conductivity of 0.4 dS/m and a pH of 7.2.
The irrigation schedule was timed to meet the crop water requirements of treatment T1 at a 7 days interval if rainfall is missing. The irrigation amount under full-irrigated treatment (T1) was equivalent to the previous 7-day evapotranspiration (TWD) of the crop. For the other regimes (T2 and T3), the amount of water applied is reduced according to the equation 1.
Actual crop evapotranspiration (ETa) was estimated using the water balance equation given as follows:
(3)
In which ETa is the actual evapotranspiration of the crop (mm), P is the rain (mm), I is the irrigation amount provided (mm), D is the drainage losses beyond the root zone (mm) estimated using AquaCrop model previously calibrated and validated for winter wheat (Bouazzama et al., 2017). ΔS is the variation in soil water reserve estimated using formula:
∆S= (S2 − S1) da · Z/100 (4)
Where S1 and S2 are the initial and final soil water content (%) in the soil layer respectively, da is the apparent density (g.cm-3), and Z is the thickness of the considered soil horizon (cm).
Water use efficiency was calculated for each water regime by:
WUE = Y/ETa (5)
In which Y is the grain or biomass yield (kg/ha) and ETa is the actual evapotranspiration of the crop (mm) given by formula 3.
Observations on plants at each treatment were carried out at harvest. Grain yield and yield components were determined at maturity on plots of about 8 m2, corresponding to six center lines, each of 6 m in length.
Monitoring of soil water content was made before each irrigation event and at harvest. Conventional oven dry (gravimetric) method was used to evaluate soil water content at soil layers 0-20, 20-40, 40-60, 60-80, 80-100 and 100-120 cm. During the 2nd year, in addition to gravimetric method, more soil water content measurements have been performed by means of PR2 probe of DeltaT Devices Ltd. Tensiometers were installed for each treatment at 30, 50, 70 and 100 cm for monitoring soil water tension twice a weak.
Statistical analyses
Experimental data were subjected to the analysis of variance (ANOVA) and the test of the least significant difference (LSD).
RESULTS
Water applied for each water regime
During the first year experiment, the differentiation of water supplies between the three water regimes started at the 4th week of February after the start of the rainy period. Water inputs were systematically applied every week for all the water regimes. In 2nd cropping season, the late rains imposed to start irrigation earlier after wheat sowing. Differentiation between irrigation treatments started from the 2nd irrigation applied at December 22th of 2015. In all cases, the amount of water applied to each treatment was based on the accumulation of crop evapotranspiration during the previous week, with a reduction coefficient specific to each irrigation regime. This method involves water amounts varying according to each treatment (Table 3). Irrigations requiring duration less than 20 min, the minimum duration to achieve acceptable water distribution uniformity for drip irrigation installation, have been avoided. Based on amount of water applied under T1 regime, water supplies in 2014/15 made up 62 and 38% under T2 and T3 respectively. In 2015/16, amount water applied represented 76 and 52% under T2 and T3 respectively.
Wheat water requirements were calculated using crop coefficients of FAO, adjusted to Tadla climatic condition, and reference evapotranspiration determined by FAO Monteith-Penman equation. Daily weather data were taken from local climate station situated near the experiment site. The water requirements of wheat in Tadla were estimated at 464 mm. Figure 2 shows the cumulative of crop water requirements (ETc), rain and irrigation amounts applied under three water regimes. It appears that the additional irrigations applied under regime T1 are sufficient to satisfy crop water needs given the superposition of the two evolution curves of ETc and the total supplies under T1 (Figure 2). Under the other water regimes, we note a continuous water deficit illustrated by the distance of the T2, T3 and T0 curves from that of ETc.
Soil water content and water tension in the soil profiles
Soil water content measured in the profile during the first growing year (2014/15) was represented for two distinct periods: rainy period from December to February (Figure 3) and dry period starting from March and characterized by rain shortage and intensive application of water (Figure 4). The soil water contents (Figure 3) were taken as averages from several measurements at different horizons and dates. In Figures 4, the average values reported for each water regime correspond to water contents before each irrigation. The average values of soil humidity at wilting point (HpF) and humidity at field capacity (Hcc) are respectively 21.1 and 37.3 % .
Analysis of the water content values obtained during the rainy season showed no difference among measurements. For the total soil profile, we distinguished two different soil layers where water contents were relatively high (an average of 31% at 0-40 cm) and relatively medium average soil water content of 24% beyond 50 cm.
The soil moisture measurements performed on the period when the water regimes are applied and differentiated are illustrated in Figure 4. In general, water contents increase with depth but drying to the surface, especially in the rainfed conditions where the humidity drops below Hpf (21.1%) throughout the profile. Layers water contents follow a descending constant order with higher values ranging from T1 to T0 which does not receive irrigation water. Water contents begin to decrease in T1 beyond 90 cm deep and remains far below Hcc which is 37.3%. This shows that drainage losses beyond this depth would be low or even zero.
During the 2nd growing year (2015/16), water content monitoring was conducted using the soil moisture PR2 probes. The probe access tubes were installed on the sowing line between dripper’s lateral. The use of this type of sensor has multiplied the number of observation and avoided changing the measurement points. Since the application of water regimes has been initiated earlier, water content profiles were determined on all the growing period and shown in Figure 5.
A descending trend of average water content ranging from T1 regime to rainfed conditions is observed. Water contents measured on rainfed plots range between 15 and 20%. The differences between water regimes become less pronounced at depth. Under irrigated systems, water content variation is high in surface horizons (0-40 cm) in comparison to the deep horizons. The soil moisture was relatively stable and low beyond 40 cm. This moisture distribution is related to the depth reached by roots and evaporation affecting especially the surface layers.
The evolution of the soil water tension under the studied water regimes is shown in Figure 6 from December 10th 2014 to May 5th of 2015 to assess the change in soil water at different depths of 30, 50, 70 and 100 cm corresponding to the boundary of the area that contains the maximum root system of wheat.
During the monitoring period, there were two phases. The first period is during the rainy season ending in early March, when the rain reduced the water tension to low values around 10 cbar at the surface horizons and 20 cbar in the deeper layers.
The second period is from the 2nd week of March 2015, where soil water tension evolution varies depending on water regimes. An important rain event occurred over the middle of March bringing back soil water tension to below 10 cbar. After this period, soil water tensions increased and decreased according to irrigated regimes where different water amounts are applied. The soil water tension increased to high values after stopping irrigation at the beginning of May.
Confrontation of water deficit before irrigation and applied irrigation water
The confrontation of water deficit before irrigation and irrigation water amount applied for three treatments are shown in Figure 7. Water deficit before irrigation ranged from 11 mm recorded before irrigation applied on January 06th of 2015 and 44 mm measured before the last irrigation before harvest. Note that January early irrigation was applied with the same amount on all water regimes after the 2nd nitrogen application.
In general, water supplies under T1 are correct as couple points (deficit-water amount) are close to the bisecting line. This shows that the deficits have been offset by irrigation and the water amounts applied are not excessive. Under deficient treatments (T2 and T3), water supplies are lower than deficits recorded before irrigations. In the 2nd growing year, the same trend is observed. Water deficit before irrigation varies between 14 mm to 40 mm. Note that T2 and T3 regimes remain in deficit because of reduced irrigation amount applied in comparison with T1 regime.
Grain yield and yield component analysis
Table 4 reports the average yields of grain and straw recorded under each water regime. For both cropping seasons, analysis of variance showed that the effect of water regime was significant (p< 0.05).
Results of the first growing year (2014/15) showed that the effect of irrigation on yield was remarkable since the yield obtained under rainfed conditions are lower compared to irrigation regimes. Similarly, there is a systematic decrease in yields with water stress without statistical significant differences between T1 and T2 on the one hand and between T2 and T3 on the other. This shows that a reduction in water supply by 33% does not cause significant yield decreases. Average improvements in grain yield compared to rainfed conditions were 125%, 44% and 32% respectively under T1, T2 and T3 (Table 4).
During the 2nd growing year, there is a general increase in yields compared to the first year especially in the irrigated regimes. This can be attributed partially to the previous crop effect represented by the bean. Yields range from 4.2 t/ha obtained under rainfed conditions and up to 8.9 t/ha obtained under T1 regime. The harvest index was also higher going from the driest to the wettest treatments and varies between 33 and 49%. It was found that there is a very highly significant difference (p < 0.001) in terms of straw yield and grain yield between water regimes. The wettest treatments recorded the highest yields.
The analysis of variance showed that water regime does not significantly affect the number of spikes/m² and the TGW (p > 0.05) while the number of grains/spike varied significantly (p < 0.05).
For the number of grains/spike yield component, it varied between 22 and 41 grains (Table 5). Treatments T1, T2 and T3 had a number of grains/spike closest to the standards in irrigated areas and arid and semi-arid zones which is of the order of 35 to 40 grains/spike.
For the thousand grain weight (TGW) component, it varied between 50.9 to 57.4 g (Table 5). The weight was higher for well watered regimes T1 and T2. From this, it can deduced that treatments T1 and T2 were able to ensure grain filling conditions by translocation of more stored reserves to the grain.
Water use efficiency
Actual evapotranspiration (ETa) and calculated water use efficiency (WUE) are summarised in Table 6. According to the results, water use efficiency varies depending on water regimes between 13.4 to 16.2 kg/mm/ha.
During the first growing season, water use efficiency was better under T2 treatment while the lowest value was obtained under T1, without water restriction. In 2015/16 season, the treatments T1 and T2 recorded the highest value of WUE.
The relationship between grain yield and actual evapotranspiration (ETa) given by the water balance for each growing season is illustrated in Figure 8. This result is of great importance at the level of the scheduling of irrigations, particularly in situations of severe stress. In general, grain yields increased with evapotranspiration under each treatment. A significant linear relationship was established between actual evapotranspiration and grain yield, with R² coefficient of 0.92 and 0.99, respectively in the first and second growing season. The slope of this linear line gives the overall water use efficiency of the studied durum wheat variety. In this study, the slope values obtained are 13.5 and 17.0 kg/mm/ha, respectively for the first and second season. The parallelism between the two regression lines of grain yield and ETa for the two growing season could be related to several factors, mainly the climatic conditions and the effect of the previous crop (a legume) which favoured the improvement of yields during the second growing season. The combination of the values of the two cropping seasons gives a linear relationship with an R2 around 0.55.
DISCUSSION
The Tadla irrigated perimeter is experiencing a strong dynamic of conversion from flood to drip irrigation. This change, led by the farmers themselves, initially concerned the main tree species such as citrus fruits and olive trees. However, with the establishment of the collective reconversion program by the Moroccan State and which has a target of 49,000 ha (ORMVAT, 2008), all major crops are concerned by this new change. The lack of studies on the feasibility of micro irrigation of field crops which completely cover the soil such as wheat raises several questions among farmers. The results obtained in this study are encouraging for the generalization of drip irrigation on all crops grown in rotation.
Supplemental irrigation of a wheat field equipped with drip irrigation is feasible with a weekly irrigation frequency in addition to the rains. With average water rates of 347 mm, 236 mm and 172 mm, we obtained average grain yields of respectively 8.2, 7.2 and 6.0 t/ha. On the same variety, supplemental irrigation trials conducted by Boutfiras et al. (1997) obtained yields varied from 4.1 to 6.0 t/ha depending on the application stage. The yields obtained by the same authors in rainfed farming were of 3.1 t/ha. The maximum evapotranspiration (ETc) of the Karim variety was estimated by Baidada (1989) under Sais conditions at 498 mm. The water use efficiency obtained by this study was 14.3, 15.5, 14.2 and 13.9 Kg/mm/ha for respectively 100% ETc, 67% ETc, 33% ETc and rainfed. It therefore appears that the 67% ETc regime makes better use of irrigation water. This result is of great importance in terms of irrigation allocation for this crop, particularly in situations of water limitation.
CONCLUSION
In terms of this study, we can confirm that supplemental drip irrigation of durum wheat allows this crop to express its yield potential and high water use efficiency. In the collective conversion zone to drip irrigation, wheat can be grown under drip irrigation according to the ordinary crop rotations practiced by farmers. Micro irrigation installations with dripper laterals spaced 40 cm apart with integrated drippers with a flow rate of 2 l/h under a nominal pressure of 1 bar and with spacing of 40 cm are recommended. Other configurations should be tested depending on the soil type.
REFERENCES
Ait Yassine Z. (1995). Irrigation d’appoint du blé (Triticum aestivum): Gestion de l’eau et techniques culturales adaptées. Thèse de 3ème cycle, Univ. Chouaib Doukkali, El Jadida. 173 pages.
Allen R., Pereira L., Raes D., Smith M. (1998). Crop Evaporation: Guidelines for computing crop water requirements. FAO irrigation and drainage paper n°56. Rome, Italy: FAO.
Arfani A. (2002). Résultats des essais sur la diversification des cultures dans la station Ouled Gnaou.
Bahaja M. (1994). Irrigation d’appoint et efficience d’utilisation de l’eau dans le blé. Mémoire de troisième cycle. Agronomie. Rabat. Maroc. IAV Hassan II. 143 p.
Baidada A. (1989). Elaboration et validation du modèle de simulation du déficit hydrique. Application aux études agro-climatiques régionales. Mémoire de troisième cycle de l’IAV Hassan II- Rabat. 143 p.
Bouazzama B., Karrou M.., Boutfirass M., Bahri A. (2017). Assessment of AquaCrop model in the simulation of durum wheat (Triticum aestivum L.) growth and yield under different water regimes. Rev. Mar. Sci. Agron. Vét., 5: 222-230.
Boutfirass M. (1997). Economie et efficience d’utilisation de l’eau en agriculture par l’irrigation d’appoint des céréales. Mémoire d’ingénieurs en Chef. Settat, Maroc: INRA, 47 pp.
Chati M.T., El Bouhali I., Bekraoui A., Handoufe A. (1999). Synthèse des résultats de 12 années d’essais des besoins en eau de la betterave à sucre dans le Tadla. Séminaire sur «L’économie de l’eau», ORMVA du Haouz, 1999.
Ferrahi M, Bekkaoui F. (2020). Cereal sector in Morocco. Morocco and the Wheat Initiative. 2 p.
Hoff H. (2018). Mainstreaming climate adaption into watershed management. Climate protection programme for developing countries. Indo-German Bilateral Project on Watershed Management, 151p.
Kharrou M. H., Salah R., Ahmed C., Benoit D., Vincent S., Michel L., Lahcen O., Lionel J. (2011). Water use efficiency and yield of winter wheat under different irrigation regimes in a semi-arid region. Agricultural Sciences in China, 2: 273-282.
MAPM (2016). Données statistiques.
MAPM (2019). Données statistiques.
Chouhan S. S., Awasthi M. K., Nema, R. K. (2014). Maximizing water productivity and yields of wheat based on drip irrigation systems in clay loam soil. International Journal of Engineering Research & Technology, 3: 533-535.